

Overview of Markets
The Isolated Markets page lists every market available across the supported networks. From there you can open any market to see its full details and your position.
Finding Isolated Markets
In the app's top navigation, open the Borrow menu and choose Isolated Markets under Spark Isolated Markets.
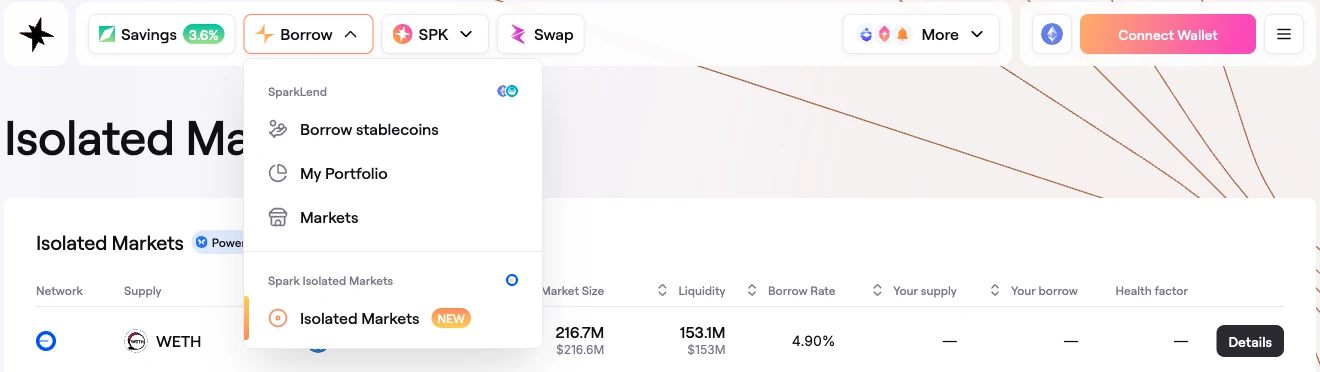 The Borrow menu: SparkLend and Isolated Markets
The Isolated Markets list
The list page shows a table of all markets across the supported networks — the Network column shows the chain each market lives on.
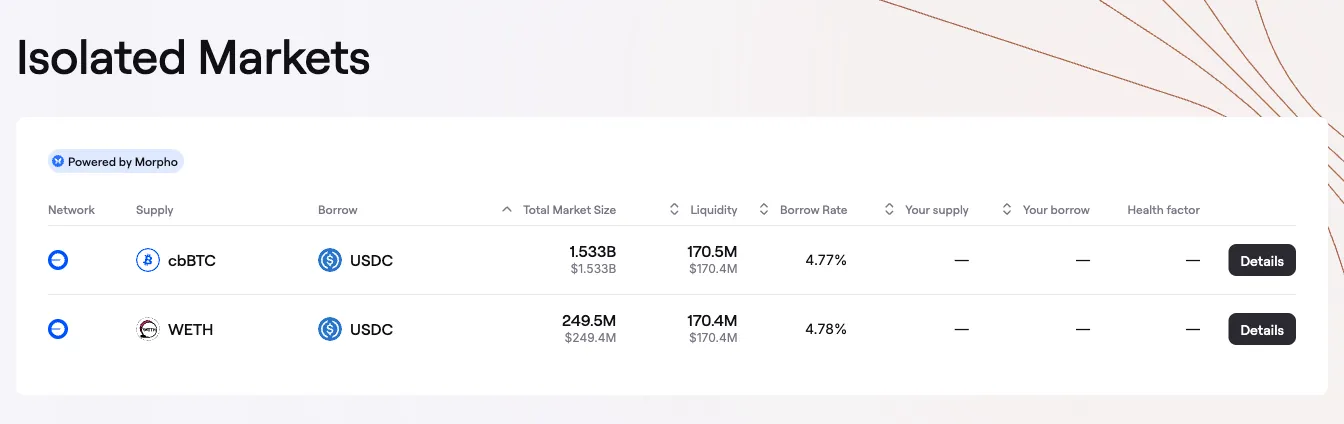 The Isolated Markets list page
Each row in the table shows:
- Market — the collateral/loan pair (e.g. WETH / USDC).
- Network — the chain the market is on.
- Total Market Size — total value supplied to the market.
- Liquidity — how much of the loan asset is available to borrow (including liquidity reachable through the Public Allocator).
- Borrow Rate — the current borrow APY.
- Your supply / Your borrow — your position in that market, if any.
- Health factor — the Health Factor of your position in that market, if any.
Click Details on any row to open the market.
The market details page
The market details page has two tabs: Details (market information) and My position (your supply, borrow, and Health Factor).
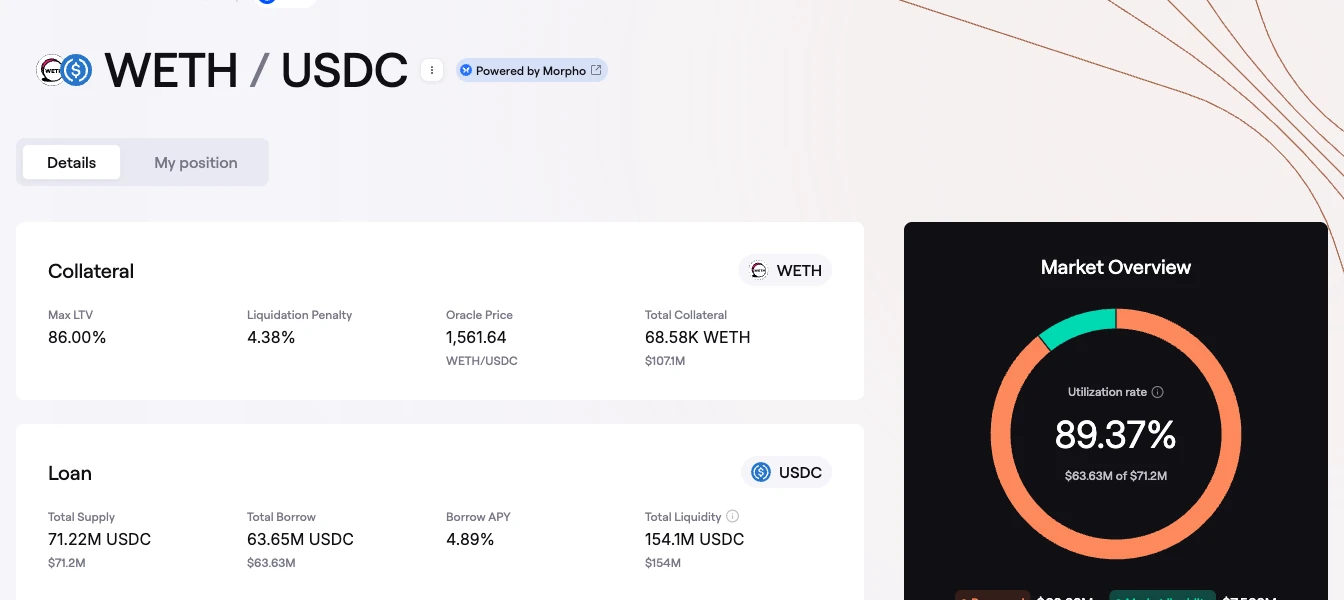 Market details — Details tab
Collateral panel
Shows the collateral side of the market:
- Max LTV — the market's LLTV; the maximum share of collateral value you can borrow.
- Liquidation Penalty — the penalty applied if your position is liquidated.
- Oracle Price — the price of the collateral asset in units of the loan asset.
- Total Collateral — collateral supplied to the market overall.
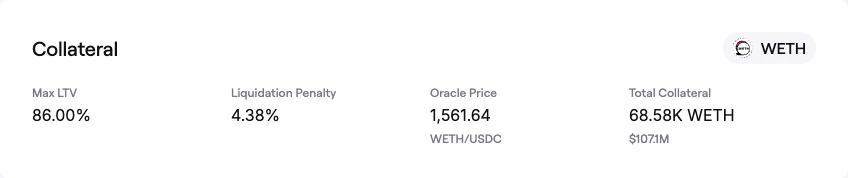 Collateral panel
Loan panel
Shows the loan side of the market:
- Total Supply and Total Borrow — market-wide supplied and borrowed amounts.
- Borrow APY — the current borrow rate.
- Total Liquidity — liquidity available to borrow. Hover the information icon to see the breakdown between Market Liquidity and Public Allocator Liquidity (read more).
A chart below plots the historical borrow rate.
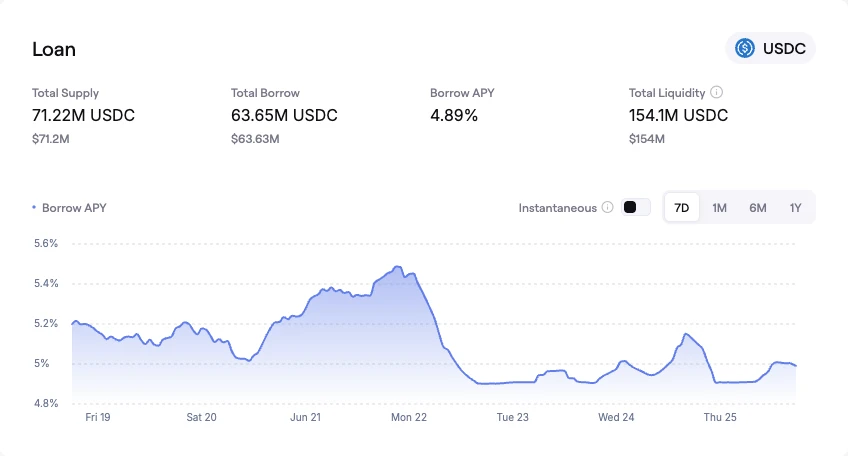 Loan panel with the historical borrow-rate chart
Market Overview
A breakdown of how the market's capacity is split between Borrowed, Market liquidity, and Public Allocator liquidity, with the total Available to borrow shown below.
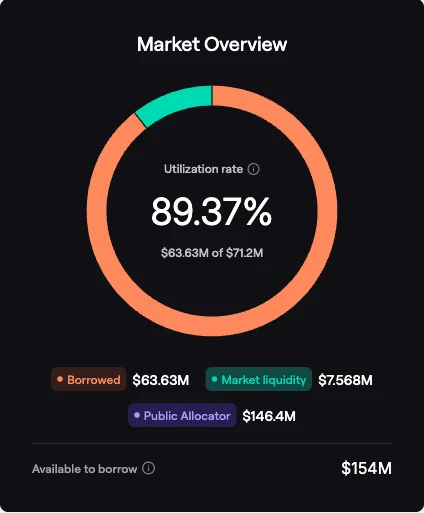 Market Overview: borrowed vs. available liquidity
Oracle panel
Shows how the market prices collateral against the loan asset. The price is derived: the collateral asset's oracle price is divided by the loan asset's oracle price. The panel links to the underlying oracle feed contracts on the block explorer. Like all Morpho markets, the oracle is set when the market is created and is immutable.
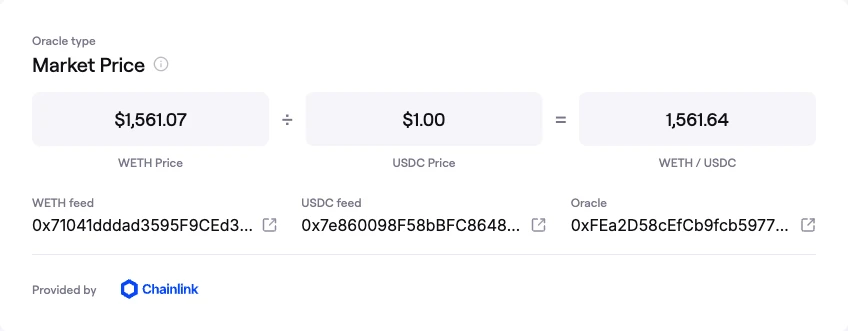 Oracle panel: derived market price
Interest Rate Model
Shows the market's current Utilization Rate and a curve of the borrow rate at different utilizations, plus a link to the IRM contract.
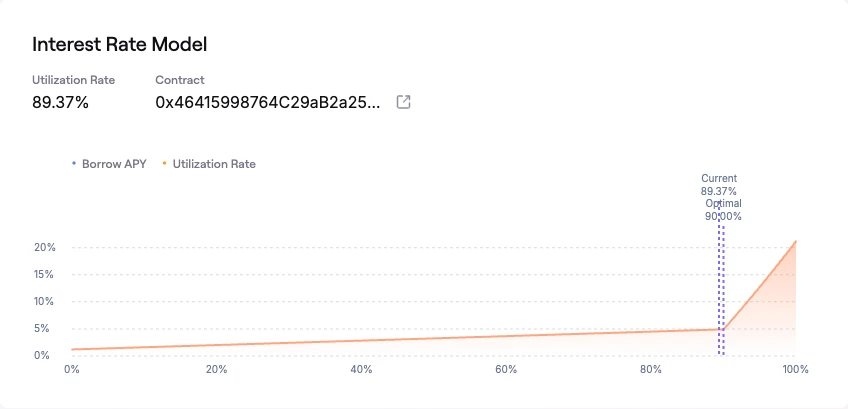 Interest Rate Model curve
My Wallet
When your wallet is connected, this panel shows your balance of the collateral asset and gives you quick Supply and Borrow buttons to act on the market.
 My Wallet panel
My position
Switch to the My position tab to see your supplied collateral, your borrow, what is available to borrow, and a Health Factor gauge with the current and liquidation price ratios. From here you can supply more, withdraw, borrow more, or repay.
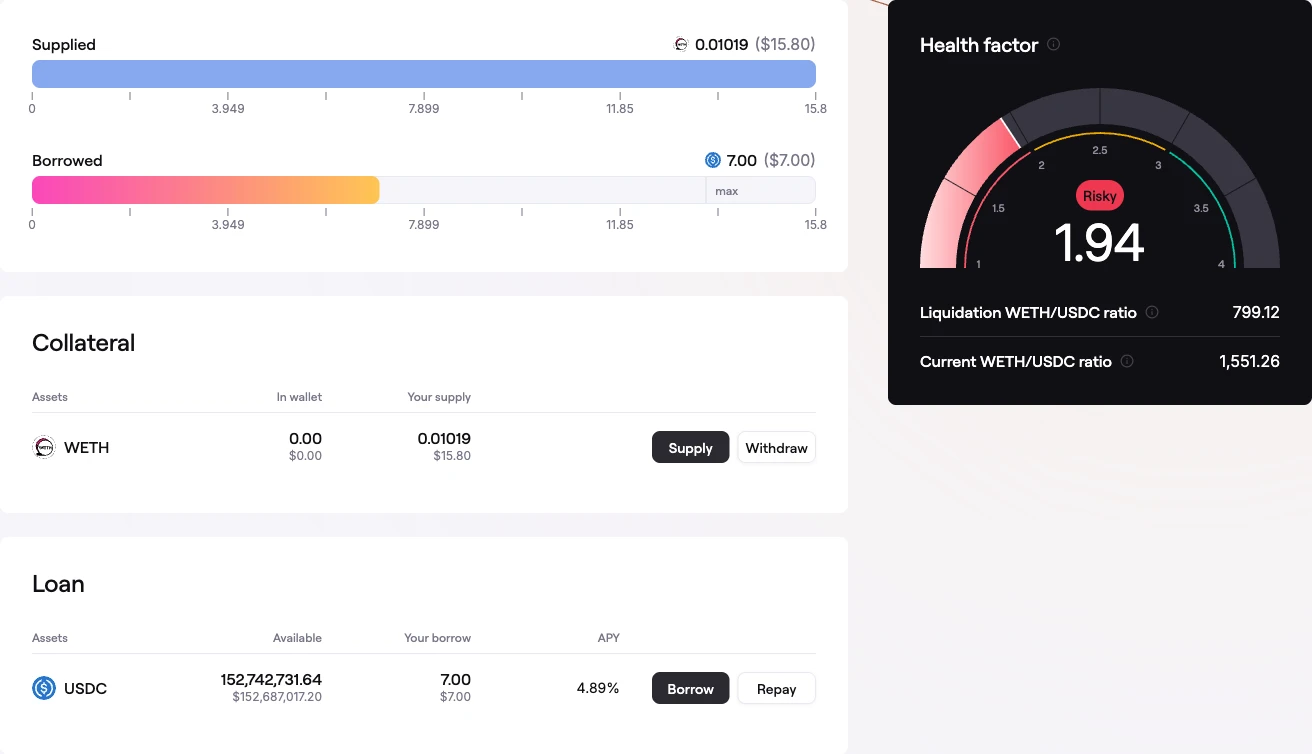 My position tab